Our map of the Milky Way has been upgraded, and it now lets us rewind the paths of stars to look back in time. The data set that enables this, released by the European Space Agency’s (ESA)’s Gaia space telescope, includes the detailed chemical make-up and speeds of almost 2 billion stars.
From its vantage point 1.5 million kilometres from Earth, Gaia has been measuring already known stars and seeking new ones since its launch in 2013. The first data release, published in 2016, contained information on the brightness and positions of 1.1 billion stars, and a second release in 2018 followed up with the colours, temperatures, and radii of a total of 1.7 billion stars.
Now, ESA has published information on almost 2 billion stars overall, increasing the number that we know the chemical compositions of by a factor of 10 and the number of radial velocities – how fast they are moving away from or towards us – by a factor of five. It also provides greater detail on star temperatures, colours, and masses.
What’s more, the information hoard contains the largest known catalogues of binary stars, asteroids, and moons, as well
as millions of other galaxies.
Gaia can now produce more detailed chemical and radial velocity maps than ground-based telescopes, which will allow us to trace the Milky Way’s evolution. “Gaia is like a time machine that allows us to look back and infer the history of our galaxy,” says George Seabroke at University College London.
To create this chemical map, which tells us where stars form and where they came from based on the metals they contain, Seabroke and his colleagues analysed Gaia’s latest spectroscopic data. This contains varying frequencies of starlight, which is linked to the chemical make-up of the stars.
Galaxy evolution
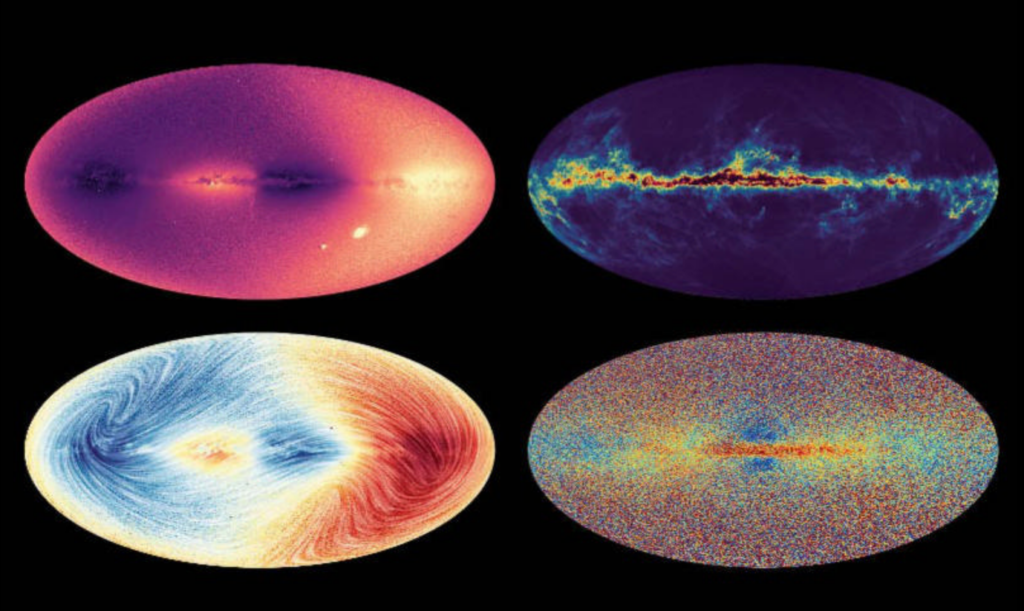
Measurements from Gaia’s spectrometer also helped produce the most detailed radial velocity map of the Milky Way. This tells us which stars are moving away from or towards us when looking at the galaxy from the side on. When combined with the motion of the stars as seen from Gaia, this 3D map can help us trace how the galaxy might have evolved.
“You can run time forwards and backwards when you know their orbits,” says Seabroke. “So, for a particular star, you can point to it and say, ‘I want to know where that star was billions of years ago’, and you can do that with these models.”
Repeated measurements
of the same stars has helped separate out stronger signals from statistical noise. One consequence of this is that Gaia appears to be able to detect small variations and vibrations on some star surfaces that it wasn’t originally designed to pick up.
One particular type of tsunami-like vibration that changes a star’s shape, known as a starquake, was detected on some stars where it shouldn’t have been possible according to current theories. “Gaia is opening a goldmine for ‘asteroseismology’ of massive stars,” said Conny Aerts at KU Leuven in Belgium in an ESA statement.
ESA has performed some preliminary analysis on the data set, but more discoveries will arrive in the coming months and years as the scientific community examines it in more detail.